Case Study

Rebuilt Financial SaaS Data Warehouse: 26 Reports, 75% Faster

Roko Labs rebuilt the data warehouse stack for a financial content platform serving Wells Fargo, Merrill Lynch, BlackRock, and Edward Jones. Six months, Snowflake, dbt, AWS data lake. 26 customer reports migrated, 75% faster report creation, $10M+ Analytics revenue opportunity in 2026.

modernized AI Dashboard for a Financial Institution

Client

A financial content distribution platform serving Wells Fargo, Merrill Lynch, BlackRock, Edward Jones, and other financial institutions.

Project Duration

6 months

The Challenge

A financial content distribution platform partnered with Roko Labs to modernize its internal reporting system. Originally a simple BI tool, the system had grown into a fragile, monolithic platform that resisted change. Analytics and reporting logic lived inside application code and SQL queries, making them hard to trace, test, or reuse. Every schema change in a source system broke hard-coded formulas and triggered manual fixes.

The system couldn't handle more than basic transformations. Refreshes and report generation slowed regularly. Machine learning, automation, and real-time insights stayed out of reach.

The Vision

The platform serves hundreds of thousands of marketing and compliance professionals at financial institutions each year. Each interaction generates data on content usage and trends. The vision was to surface that data as analytics, then open it up for machine learning, automation, and real-time insights.

The new architecture integrates MySQL and PostgreSQL with an AWS data lake, a Snowflake warehouse, and dbt for transformation. The work involved rewiring existing reports for accuracy, integrating multiple data streams for session tracking, and rebuilding the pipeline, visualization, and reporting layer.

Project roadmap timeline showing architecture and planning, prompt management UI development, analytics implementation, and deployment phases.

Solution

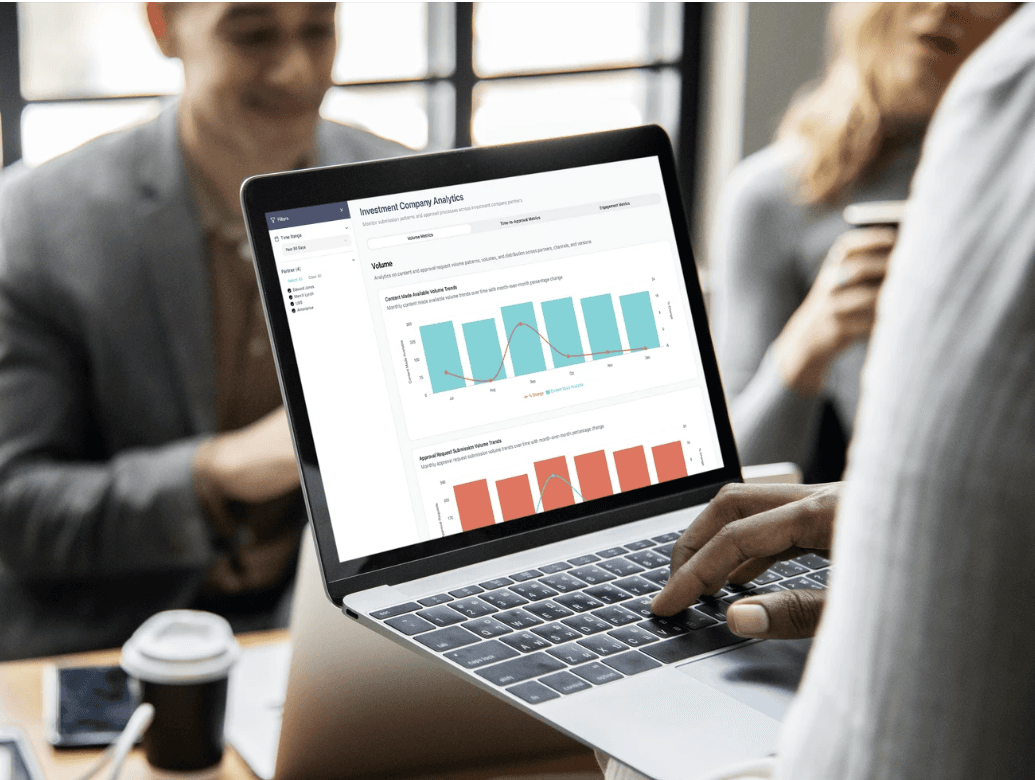
We rebuilt the visualization layer on Superset, an open-source BI tool. Superset replaced the legacy reports and added filtering and drill-downs that were not available before. Configuration changes ship without formal development releases.

We selected Superset, an open-source BI tool, to replicate existing Analytics reports.

Superset offers built-in features like filtering and drill-downs, adding interactivity previously unavailable.

It’s also easy to configure, enabling faster and more efficient delivery of updates and new visualizations without formal development releases.

Analytics summary dashboard displaying activity metrics, performance charts, total activity trends, and company breakdowns.
People working at desktop computers in a modern office, reviewing data dashboards and collaborating at workstations.
Person using a laptop displaying an analytics dashboard on a small table in a modern indoor workspace.

Technology

The global data architecture unifies information architecture and data governance across three data consumers: the core application, internal BI, and AI/ML. The company now governs, secures, and shares data centrally.

01.

Global Data Architecture

02.

Architecture Details

03.

Orchestration Details

04.

Data Warehouse: Raw Layer

05.

Data Warehouse: Cleaned & Modeled Layers

06.

Data Warehouse: Transformation Layers

This architecture unifies information architecture and data governance across data consumers (the core application, internal BI, and AI/ML)

Global Data Architecture diagram

01.

Global Data Architecture

This architecture unifies information architecture and data governance across data consumers (the core application, internal BI, and AI/ML)

Global Data Architecture diagram

02.

Architecture Details

03.

Orchestration Details

04.

Data Warehouse: Raw Layer

05.

Data Warehouse: Cleaned & Modeled Layers

06.

Data Warehouse: Transformation Layers

The Results

The new architecture cut maintenance overhead, sped up report development, and centralized data governance across the core application, internal BI, and AI/ML consumers. Reports that previously required engineering releases now update through configuration changes. Data is shared securely with internal teams and external users under a single access model.

26

Customer reports updated and data sources refreshed from the new pipeline.

75%

Faster report creation time relative to the former, monolithic system.

$10M+

Revenue opportunity in 2026 for the new Analytics product.

Need a custom AI solution?
See how we turn ideas into real products.

Have a similar task or project? Let's talk about it!

Have a similar task or project? Let's talk about it!

aria-label="Home"

Copyright © 2026 Roko Labs Inc.

All rights reserved.

1250 Broadway, 36th Floor, New York, NY, 10001

aria-label="Home"

Copyright © 2026 Roko Labs Inc.

All rights reserved.

1250 Broadway, 36th Floor, New York, NY, 10001

aria-label="Home"

Copyright © 2026 Roko Labs Inc.

All rights reserved.

1250 Broadway, 36th Floor, New York, NY, 10001

aria-label="Home"

Copyright © 2026 Roko Labs Inc.

All rights reserved.

1250 Broadway, 36th Floor, New York, NY, 10001